Selection Benchmark
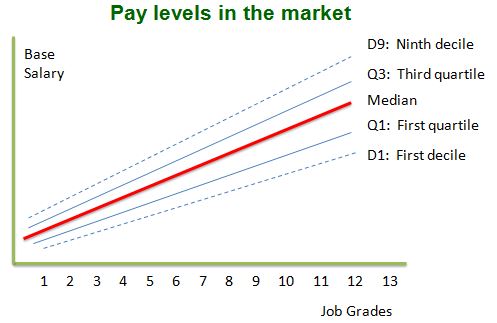
Based on the core activities of your organization we can advise on an appropriate benchmark in the relevant market. Relevant criteria can include industry type, geographical coverage, pay composition, locals vs expatriates etc.
Benchmarking
We can benchmark your current pay elements against the selected market level in the market(s) relevant to you. This applies both to fixed and variable pay. We search for multiple pay data of various countries and industries. In cases where relevant pay data are not readily available we can conduct a “sponsored” survey.
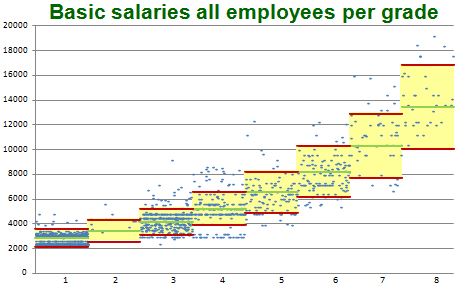
Scatter Diagram
A Scatter Diagram shows your current pay practice against the benchmark. This Diagram contains a wealth of information, including the Relative Salary Position (salary distance to the market benchmark) of your employees. In the Scatter Diagram, green circles (those who are underpaid) as well as red circles (those who are overpaid) can be detected. This overview creates an opportunity to optimize the pay policy, in line with the benchmark, tailor-made to the organization.